ROI Analysis For Sports Facility Investments: Financial Planning Guide
The Problem With Most ROI Models
I’ve sat through enough sports complex pitch meetings to know when the room is selling adrenaline instead of economics, and it usually starts with a shiny demand slide, a breathless tournament calendar, and a revenue chart that quietly assumes every operational headache will somehow behave itself. It won’t. Ever.
That’s the trap.
But people still fall for it, because “sports facility investment” sounds cleaner than it is. Cleaner than staffing shortages. Cleaner than warped frames, torn netting, fried HVAC, dead weekday blocks, insurance hikes, and that lovely moment when a cheap equipment buy turns into a six-month maintenance bleed. I’ve seen it.
Here’s the ugly truth: a full parking lot means almost nothing by itself. You can have packed Saturdays, happy parents, busy courts, and a building that still throws off weak cash once payroll, utilities, repairs, reserve funding, and replacement cycles stop being theoretical line items and start chewing through the P&L like they always do. Busy isn’t enough.
And that’s where most sports facility ROI analysis goes bad. Not slightly bad. Structurally bad. People blur revenue with margin, blur margin with cash flow, then smuggle civic “impact” into owner return as if hotel taxes and nearby restaurant receipts are somehow landing in the operator’s bank account. They aren’t.
Demand Is Real, but Demand Alone Doesn’t Save a Bad Model
Demand is real, obviously. According to the SFIA 2024 Topline Participation Report, pickleball reached 13.6 million U.S. participants in 2023, up 51.8% in one year and 223.5% since 2020, while racquet sports added 5 million participants in 2023. And in August 2024, Bloomberg reported that private equity was chasing the roughly $30 billion youth-sports business. So yes, the participation wave is there. The appetite is there. Money is sniffing around.
Still.
That doesn’t rescue a weak model. It just gives weak models better sales material.
The 2024 NRPA Agency Performance Review found average revenue-to-operating-expenditure cost recovery of 25.2% across agencies, with 46% of full-time staff dedicated to operations and maintenance. That number matters more than most of the hype. Operations and maintenance aren’t some annoying back-office detail. They are the machine room. They are where your pro forma gets mugged.
From my experience, this is the first hard filter: I want captured cash, not applause. Not “regional buzz.” Not speculative spillover. Not consultant poetry. Captured cash. What does the owner actually keep after the building gets booked, cleaned, reset, staffed, fixed, lit, cooled, heated, insured, and re-equipped? That’s the number. Everything else is side chatter.
Case Studies That Expose the Real Math
Prince William County: Great Headline, Thin Yield
Take the Prince William County feasibility study. On paper, it tells a story people love to repeat. It modeled an indoor sports and events center at roughly $120 million in construction cost, projected Year 3 operating income of about $418,833 on $4.49 million of revenue, posted a 9% operating margin, and tied the project to more than 65,000 annual hotel nights and over $50 million in annual economic output. Sounds great. For a chamber-of-commerce lunch.
For an owner? Thin.
That distinction matters more than people admit. A city can like that math for tourism reasons. A county can like it for visitation and tax-base logic. Fine. I’m not arguing with that. But if somebody tries to pitch that same case as a stand-alone private return story without a subsidy stack, land play, or adjacent monetization angle, I’m immediately skeptical.
St. Charles County: Better Ramp, Still a Long Slog
The St. Charles County executive summary tells the same story with slightly different wallpaper. Total uses of funds were projected between $129.3 million and $157.5 million, with the field-and-sport-equipment line alone at about $28.2 million to $34.5 million; revenue was forecast at $4.40 million in Year 1 and $6.29 million in Year 5, while EBITDA rose from just $37,523 in Year 1 to $862,116 in Year 5. Better ramp. Still a long slog.
And that’s before the usual gremlins show up—pricing pressure, labor drift, overtime, deferred maintenance, storage inefficiency, equipment loss, replacement lag, the whole ops-side mess that people politely call “execution risk” when they really mean “this will cost more and run clunkier than you think.”
Myrtle Beach Sports Center: Right-Sized Often Wins
Yet the more revealing number set in the Prince William report isn’t the giant proposed build. It’s the Myrtle Beach Sports Center comparable. That one feels closer to reality. The report notes an inflation-adjusted construction cost of $18.3 million, nearly $1.6 million in operating income before COVID, positive net operating income of $134,000, and about $20 million in annual direct economic impact in each of its first three full years. I frankly believe right-sized boxes beat monument projects more often than the industry wants to admit.
Because they do.
They usually have less vanity square footage, better conversion flow, tighter staffing logic, and fewer dead zones that look impressive on a rendering but become underutilized overhead in the real world. That stuff matters. A lot more than brochure language.
Facility ROI Comparison Table
Here’s the same comparison table, because the numbers don’t care how polished the pitch deck was.
| Facility / Study | Up-front cost | Operating result | Spillover / visitor result | My read |
|---|---|---|---|---|
| Prince William County indoor sports center (proposed, 2024 study) | ~$120.0M construction | Year 3 operating income: ~$418,833 on $4.49M revenue; 9% margin | 61% out-of-county attendance, 65,000+ hotel nights, $50M+ annual economic output | Strong tourism engine, weak owner cash yield unless paired with other value capture |
| St. Charles County combined complex (proposed, 2024 summary) | $129.3M-$157.5M total uses | EBITDA: $37,523 in Year 1 to $862,116 in Year 5; Year 5 revenue: $6.29M | ~72,904 room nights and ~$47.6M direct spending at maturity | Better ramp, still long payback if you judge it as a stand-alone investment |
| Myrtle Beach Sports Center (comparable operating facility) | $18.3M in 2023 dollars | Nearly $1.6M operating income; positive NOI: $134,000 | ~$20M annual direct economic impact in first three full years | The more disciplined, right-sized model is often the smarter bet |
Payback Periods and What the Numbers Really Mean
Do the math.
Simple division puts Prince William’s owner-level operating payback at well over 280 years before debt service and long-term capital reserves, and even St. Charles’ low-end cost versus Year 5 EBITDA still points to roughly 150 years. Which is why I get twitchy when someone asks, “How profitable is a sports facility investment?” without saying who’s supposed to get paid. The operator? The municipality? The adjacent hotel strip? The bond structure? Those are different stories.
And in real life, the spread between a soft project and a solid one usually comes down to utilization density. Not hype. Not logo count. Utilization density. In the Prince William model, Year 3 rental income alone was projected at $2.068 million, with average court rentals around $80 per hour, tournament facility rentals around $8,500 to $12,000 per day, and graduations at $20,000 per day. That’s the clue. One box, multiple monetization lanes.
Why Equipment Choices Affect Financial Returns
Flexible Equipment Increases Revenue Options
That’s where equipment starts to matter—not as procurement trivia, but as capital logic. If your facility can convert smoothly from league play to clinics, from camps to private training, from tournament overflow to sponsor-backed activation, then the same square footage can work harder without forcing your staff into constant reset chaos. That’s a real edge.
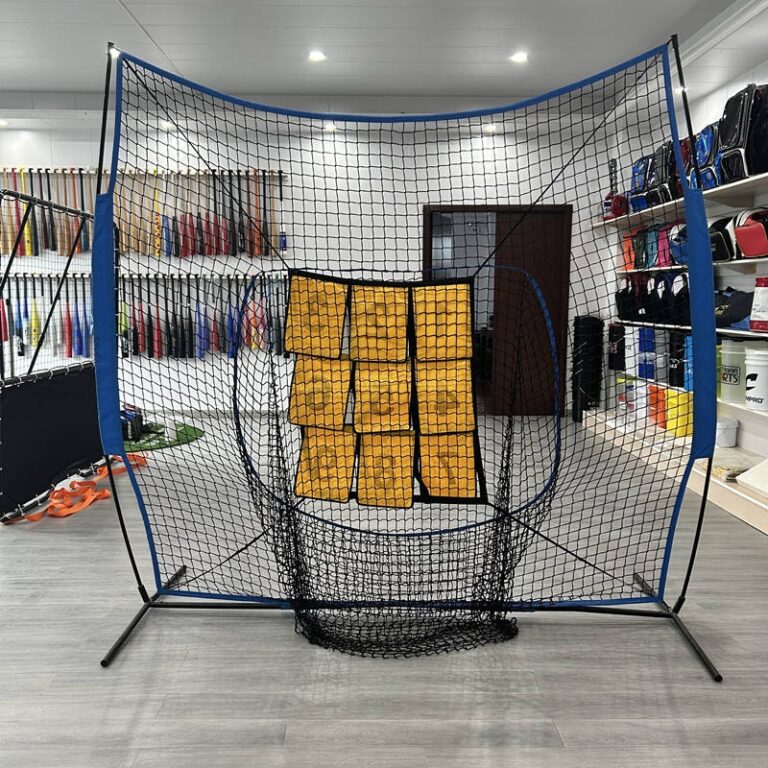
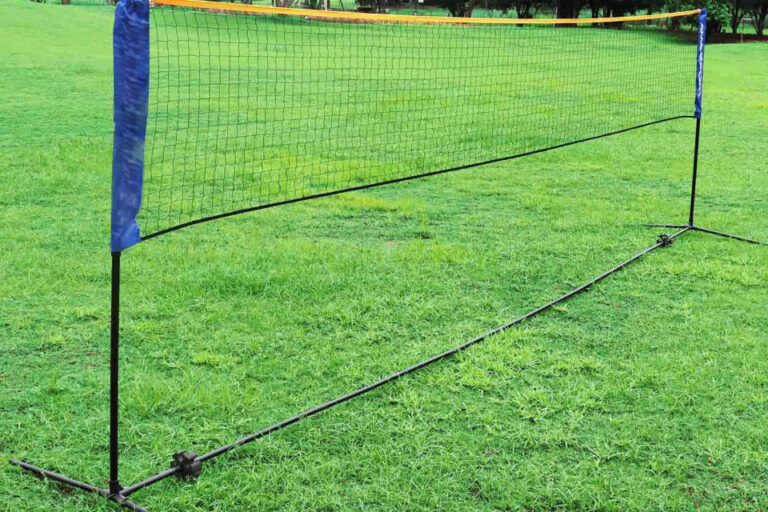
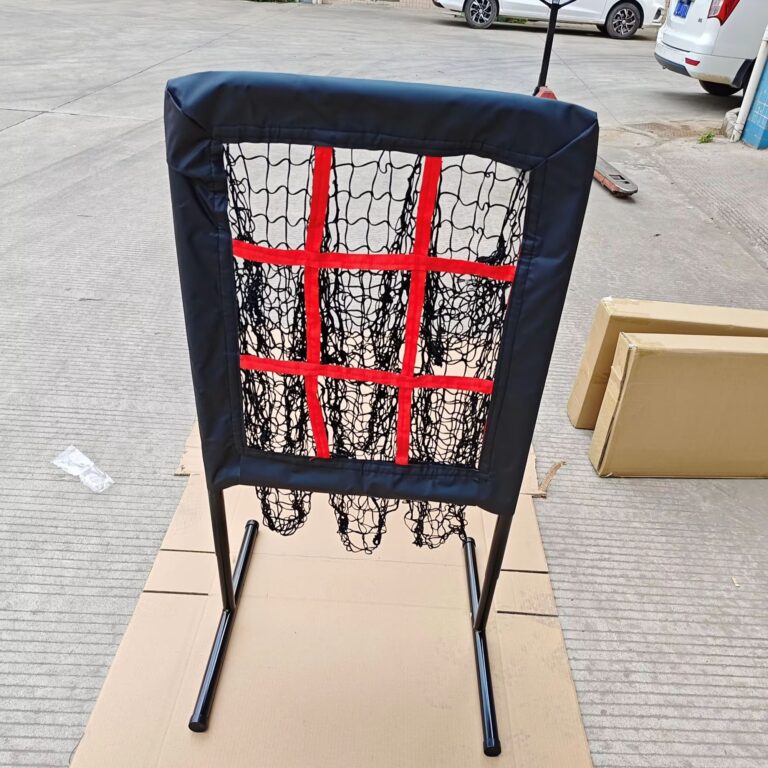
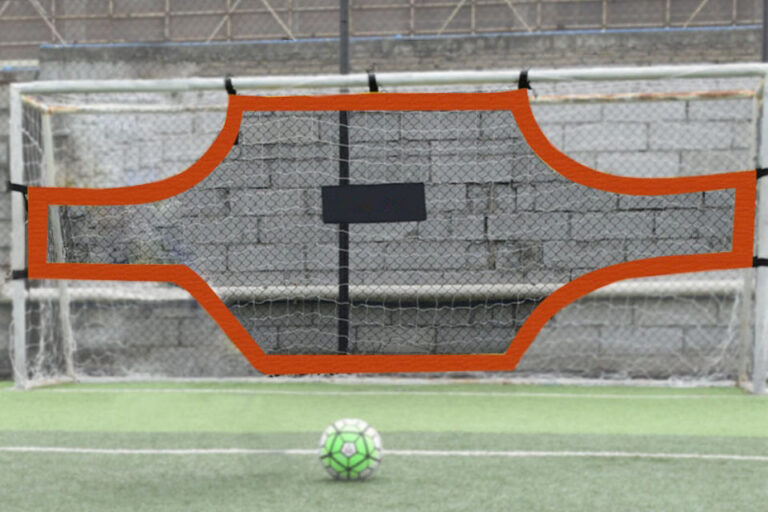
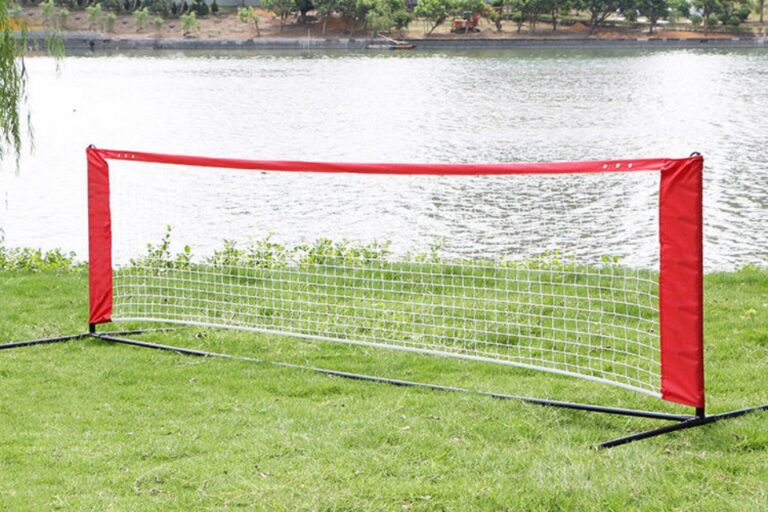
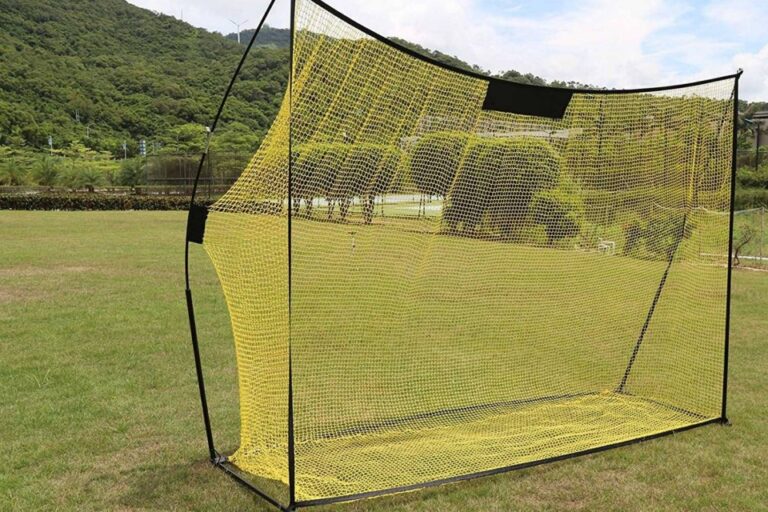
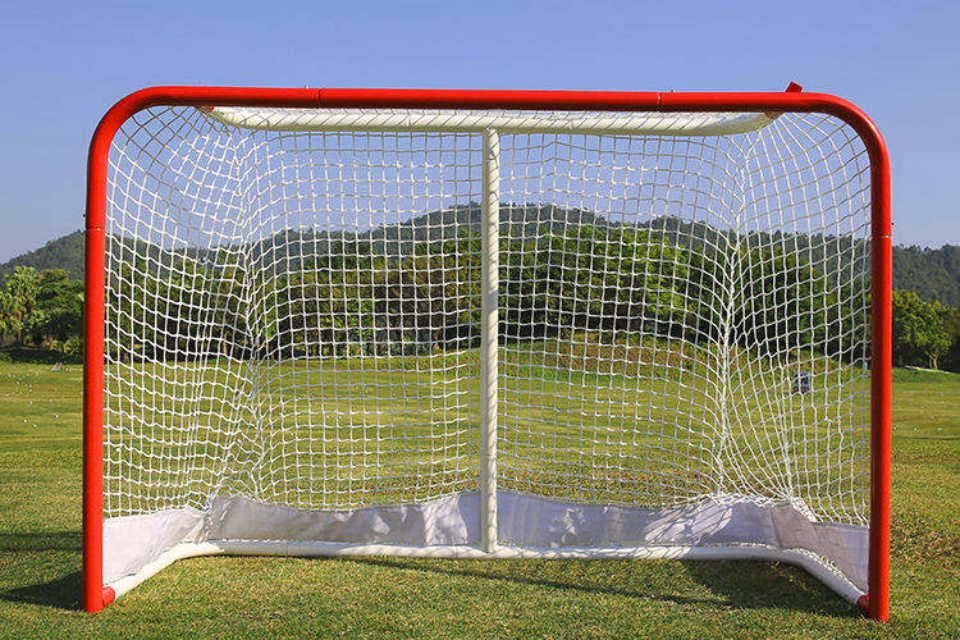
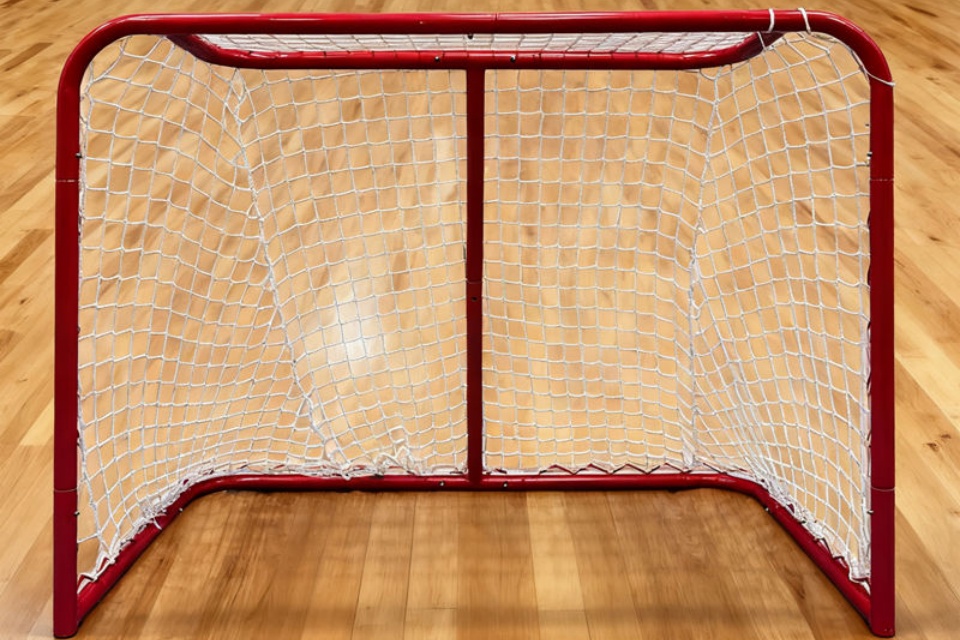
And yes, I’m biased here. I’d rather own a venue that can rotate through multi-sport net systems, add high-frequency programming with pickleball net systems, monetize slower blocks through golf net systems, and squeeze skills revenue from rebounder training equipment than some single-use shrine that looks premium and books like a ghost town from Monday to Thursday.
Flexibility sells.
Cheap Equipment Usually Costs More Later
Cheap gear, meanwhile, usually lies. It looks fine in a quote sheet. Then the welds start telling the truth. Casters seize. Tension points give out. Net pockets sag. Coatings fail under UV. Connectors vanish. Staff hate setup. Coaches complain. Events get delayed. Suddenly the “savings” are gone, replaced by downtime, workarounds, and rushed replacement orders that always seem to happen right before your busiest weekend.
I’ve watched buyers do this over and over. They grind vendors for a tiny upfront discount, feel clever for a month, and then get torched by lifecycle costs they never properly modeled. That isn’t cost control. That’s false economy wearing a procurement badge.
What to Check Before Buying Facility Equipment
So I look at the boring stuff first. Steel gauge. Finish quality. Wheel assemblies. Weld consistency. Tension hardware. Storage footprint. Swap-out time. Spare-part availability. How fast can a beat-up unit be turned back around between bookings? How much labor drag does the system create? Does the setup survive commercial churn, or is it backyard kit pretending to be facility-grade?
That’s the real checklist.
And honestly, a public factory tour tells me more than most marketing copy ever will. I want to see how things are built, not just how they’re photographed. The operators who know their floor usually care about that. The dabblers usually don’t.
My Rule for Underwriting a Sports Facility
My own rule is pretty blunt. Underwrite the deal as if labor stays annoying, weekend demand softens a bit, insurance gets nastier, utilities stay sticky, and your soft goods wear faster than the brochure promised. Then stress-test the booking mix. Then stress-test the replacement cycle. If the model still holds together after that, now we’re talking.
If not, don’t force the thing.
Because not every sports facility should be financed like an investor-grade asset. Some are public-service assets with tourism upside. Some are mixed-use plays disguised as sports projects. Some are ego builds. And some, frankly, are just overbuilt CAPEX traps with nice renderings and weak cash conversion.
FAQs
What is ROI for a sports facility investment?
ROI for a sports facility investment is the percentage return generated after total captured cash flow and terminal value are compared with total invested capital, including land, construction, equipment, financing costs, replacement reserves, and the ugly operating drag that optimistic pitch decks usually ignore. In practice, it’s the cleanest way to ask whether the project actually earns back the money tied up in it—or just stays busy while capital sits there underperforming.
How do you calculate payback period for a sports facility?
The payback period for a sports facility is the number of years required for cumulative net cash flow, not gross revenue, to recover the full project outlay, and it should be measured only after debt service, maintenance reserves, and replacement spending are deducted. Put differently, you stack annual net cash flow year by year until the original investment is truly recovered, and you don’t cheat by using topline revenue.
What revenue streams matter most in a sports facility?
The most valuable revenue streams in a sports facility are the repeatable ones that sell the same square footage multiple ways, typically court or field rentals, leagues, clinics, tournaments, concessions, sponsorship, and non-sport event days such as graduations, camps, trade shows, and birthday programming. The industry loves weekend tournament chatter, but weekday programming, conversion speed, and premium-use blocks are usually what separate a durable model from a fragile one.
How profitable is a sports facility investment?
A profitable sports facility investment is one that can fill weekdays, price weekends intelligently, control labor and maintenance creep, and survive replacement cycles without depending on rosy spillover claims, because plenty of complexes create hotel-tax headlines while producing thin owner cash flow. The honest answer is that some facilities work very well for civic or mixed-use goals, while many stand-alone private models look far better in a deck than they do in an operating statement.
Conclusion
If you’re planning a new complex, a retrofit, or just trying to stop equipment decisions from wrecking the math, start with the assets that widen your programming mix and reduce turnover friction. Then talk specifics—wear cycles, storage, setup time, replacement cadence, all of it—and reach out through the contact team before you buy something that looks cheap but performs expensive.